Frogs at our power plant taught us a new game called "Find a frog."
It's very exciting game so I thought I'd share it with you.
(Caution: not recommended to people with ranidaphobia)
Rules are easy: Look at the picture and try to spot a frog.
1.
Can you see a frog?
If you can't see a frog on the first picture↑, try the next picture↓:
2.
Any frog there?
Can you see a frog? If you don't spot the frog until the second picture (above), you lose the game.
You need more training in frog-spotting.
Check the next picture.
3.
I'm here.
The frog is subtly smiling. She just won the game.
4.
The winner.
Here's next round:
1.
2.
3.
4.
Did you win?
Final round:
1.
2.
3.
This was an introduction to "Find a frog" game.
Once you master "Find a frog", you can move to the next level "Catch me if you can."
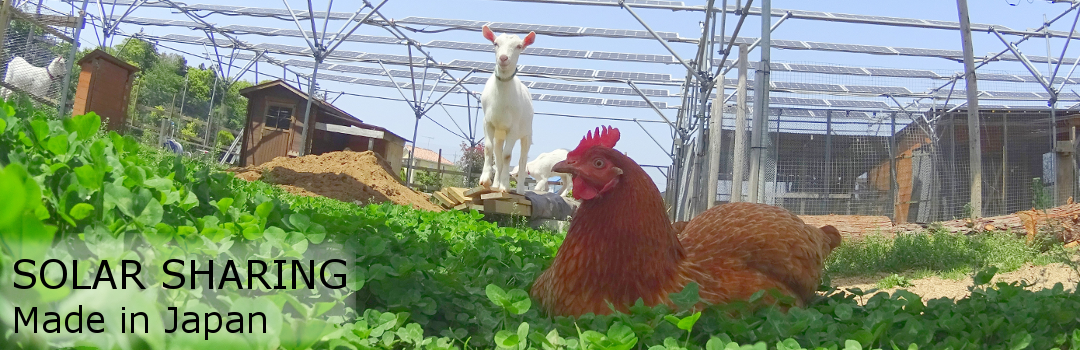
After a streak of rainy days we have a nice heat wave.
With temperatures over 34 °C and 60 % humidity in the past week, it's Japanese summer at its best.
Our chickens are torn between the feeling of being happy about the sun and being too hot because of that sun.
Chickens don't like hot weather, and it's not just some subjective feeling. There are at least four reasons why chickens are disadvantaged when it comes to really hot weather.
1. Chickens have high body temperature - about 40-41 degrees. They maintain their body temperature by losing heat into the air around them. But when the air around them is already hot, how can they lose their own body heat into it?
2. Chickens don't sweat. They don't have sweat glands to help them regulate the body temperature.
3. Chickens have a thick feather coat that makes for great insulation in winter, but inhibits heat loss in summer. It's like people wearing a thick coat on a hot day. It must feel terrible.
4. Chickens usually don't have access to air conditioning.
In other words, chickens cope with heat worse than people.
But they have a cool cooling strategy!
The first point of their cooling strategy is quite obvious: hide in the shade.
Here you can see our chickens hiding. Not a single one is outside on the sun:
Once in the shade, they lie down on the ground and take a nap. Sometimes they spread wings and do some magic that makes them feel cooler.
Second point of their cooling strategy is again similar to humans: drinking a lot of water.
Third point is panting. Chickens open their beaks and pant.
Panting, or "gular fluttering", is a cooling mechanism of many birds. If I understand it well, birds rapidly flap membranes in their throat. This vibration makes water in the throat evaporate. Evaporation helps dissipate the heat and reduce body temperature. In other words, it's birds' way of sweating?
Here are our chickens performing their cooling strategy: hiding in the shade, drinking water and panting:
The best time chickens have these days are early mornings and late evenings, when it's sunny but not hot yet. That's when their new perch gets busy:
Overall, our chickens are coping with the heat with exemplary stoicism. Who taught them that?
Past 10 days were the rainiest time I remember in my 9 year history of living in Japan.
It's rainy season so rain is to be expected. But even a rainy season usually has the decency of letting a few sunny half-days break the monotony. Not this time.
So how does the rain affect our power plant and its inhabitants?
Thanks to the rain, our power plant turned into a pond.
The reason why there is a pond is because the power plant is built on clay. I have dug many holes in order to plant 60+ hedge trees, so I know that when you start digging and get through a thin layer of topsoil embroidered with weed roots, you hit a layer of crushed stone (which is itself extremely fun to get through with a shovel). After that, you find a fine layer of heavy clay soil. On dry and sunny days, it's hard like stone and impossible to dig. On rainy days, it's gooey and you can carve it in slices and make shapes like playdough. This clay soil is virtually leak proof and helpfully keeps all the water for the weeds. Two days of rain and we have a nice pond.
Chickens don't like rain either. In fact they don't care, but if it lasts too long, the ground gets muddy, their poop gets smelly (I'm sure they find it smelly too) and generally it's not fun. You can see it on their faces.
What's worse, because of the rain, we can't work on the fence to enlarge chickens' playing area.
As expected, the 20 square meter plot we opened for them 2 weeks ago is by now completely void of grass.
Chickens' playground two weeks after opening.
No grass left, only the one I bring in.
The only greenery is the one I bring in twice a day . Chickens devour their portion of salad in minutes and in the next moment are hungry for more.
Not much fun outdoors - chickens spend more time indoors:
Their favorite indoor activity is meditation on perch:
Fortunately, there is one group of inhabitants that is thriving thanks to the rain: frogs. Another name of our power plant could be Frog Paradise. Here are some frog siblings having siesta before breakfast:
Weather forecast says the rainy binge should end tomorrow. Sun will prevail!
Here is a summary of the monthly performance of our power plant from December 2014 (the first full month of operation) until June 2015.
The best performing month so far was May with 6231 kWh of electricity produced, and the worst month was February with 4460 kWh. An average Japanese household consumes about 300 kWh of electricity a month, so our power plant produced enough electricity for 14 households in its weakest month (February) and for 20 households in the strongest month (May).
But some months have more days than others. When we take that into account and calculate average amount of electricity generated per day in a given month, we'll find out that the worst month in fact was not February (28 days) but April (30 days) - an average of 148.8 kWh was generated a day. The best month remains May with average daily performance of 201 kWh. See the graph below:
The size of our power plant is 40.71 kW in terms of installed capacity of solar panels (354 panels x 0.115 kW), and 38.5 kW in terms of maximum capacity of inverters (7 inverters x 5.5 kW).
The question I am interested in is: How many kilowatt hours of electricity does each 1 kW of installed capacity generate per year?
As our power plant has been in operation for only seven months, I don't have a twelve months worth of statistics yet. But if I assume that the same trend will continue for the next four months, I can extrapolate data from the seven months introduced above.
Power plant Oo generated a total of 35 022 kWh of electricity in the seven months from Dec. 1, 2014 until June 30, 2015. This gives us average performance of 5003 kWh/month.
This multiplied by 12 months gives us a prediction for yearly performance.
5003 x 12 = 60037 kWh/year
When we divide this yearly performance (prediction) by the installed capacity 40.71 kW, we'll find out that 1474 kWh of power will be produced annually per 1 kW of installed capacity.
60037 kWh / 40.71 kW = 1474.76 kWh
This is very good result.
Actual performance depends on many factors so it's hard to make simple comparisons, but just for reference, Japanese makers of solar power systems such as Sharp, Panasonic and Toshiba estimate annual energy production per 1 kW of their products somewhere between 1000 and 1200 kWh. (Source: Eco-hatsu {in Japanese}). In the light of that, our power plant's estimate of 1474 kWh per 1 kW of installed capacity per year is an excellent outcome.
So why is it important to push performance to the maximum?
Of course on the individual level there is financial incentive - for me, each kilowatt hour produced means a few more yens earned. But it's important from the global perspective as well: Solar power systems take a lot of energy to manufacture and install, and they have to "pay" this energy back. The more energy our power plant produces, the shorter is its energy payback time, and the higher is its net energy gain.
Energy payback time is the time it takes a solar power system to generate the same amount
of energy that was used for its manufacture and installation. So how long is that time? On average, it's "between six months to two years, depending on the location/solar irradiation and the technology," according to this 2012 article from the Center for Life Cycle Analysis at Columbia University. That's already quite short. But it can always be shorter.